

 EUR/USD
  GBP/USD
  USD/ZAR
  EUR/INR
  EUR/GBP
  XAU/USD (Gold)
  XAG/USD (Silver)
  XM Global
  AvaTrade
  RoboForex
  IC Markets
  LiteFinance
  IUX Markets
  FP Markets
  South Africa
  Thailand
  Singapore
  Japan
Japan  Pakistan
  Malaysia
  Philippines
  Brazil
  Bangladesh
  Vietnam
  India
India 
Stochastic RSI Strategy
Stochastic RSI applies the stochastic calculation to RSI values, making it more responsive to short-term momentum changes than standard RSI. Stochastic RSI may be displayed on a 0–1 or 0–100 scale depending on the platform. Higher readings indicate that RSI is near the upper end of its recent range, while lower readings indicate that RSI is near the lower end. Its faster response can help traders identify short-term momentum changes and refine entry timing, although it can also produce more false signals.That speed comes with more false signals, though, so it works best paired with the trend rather than traded on its own.




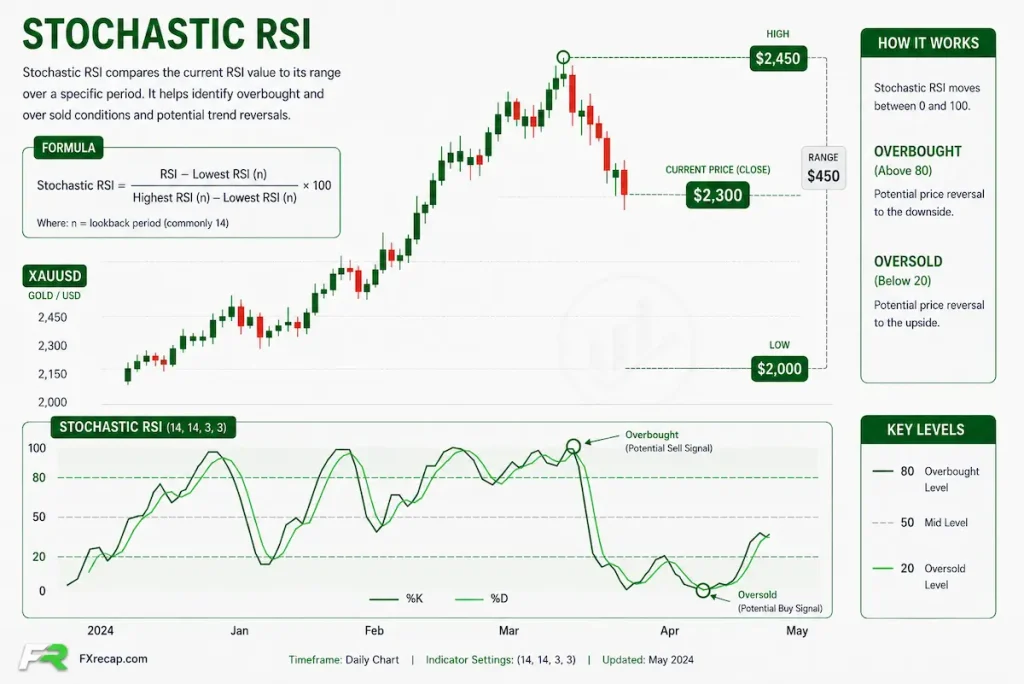
The Stochastic RSI is a faster, jumpier version of the RSI, and in a trending market one practical approach in a trending market is to use Stochastic RSI for pullback entries rather than treating every overbought or oversold reading as a reversal signal.
In a strong uptrend, Stochastic RSI can remain in the upper zone for an extended period without an immediate reversal. Selling every time it hits 80 means fighting the trend and losing. In an uptrend, one trend-following approach is to give less weight to overbought readings and look for oversold crosses as potential pullback entries. In a downtrend, flip it, ignore oversold and short the rallies.
So the strategy has two moving parts. A trend filter tells you which way to trade, usually a 50 or 200 EMA. Then the Stochastic RSI times the entry, when the fast %K line crosses the slower %D line coming out of the extreme. The trend provides directional context, while the oscillator can help with entry timing.
Treat published win-rate figures cautiously unless the market, timeframe, testing period and methodology are clearly disclosed. They come from one backtest on one market. Stochastic RSI is generally more useful as a momentum and timing tool than as a standalone predictor of future price
What It Is, and How It Differs from RSI
Stochastic RSI was introduced in 1994 as an indicator derived from the Relative Strength Index. The idea was to make the RSI more sensitive, so it gives earlier and more frequent signals.
Here is the difference in plain terms. RSI measures the strength of recent price gains and losses to assess momentum. The Stochastic RSI measures where the RSI itself sits inside its own high-low range over a recent stretch. Stochastic RSI applies a stochastic calculation to RSI values, which makes it more sensitive to short-term changes in momentum.
That speed cuts both ways. You get earlier entries, but you also get more false signals. Plain RSI might crawl toward 70 while the Stochastic RSI has already spiked to 80 and back twice. For timing an entry, that responsiveness helps. For judging the bigger picture, it is too noisy to trust alone.
The Mistake That Costs Most Traders
This is the key point, so it gets its own section. The single most common Stochastic RSI error is treating 80 as an automatic sell and 20 as an automatic buy.
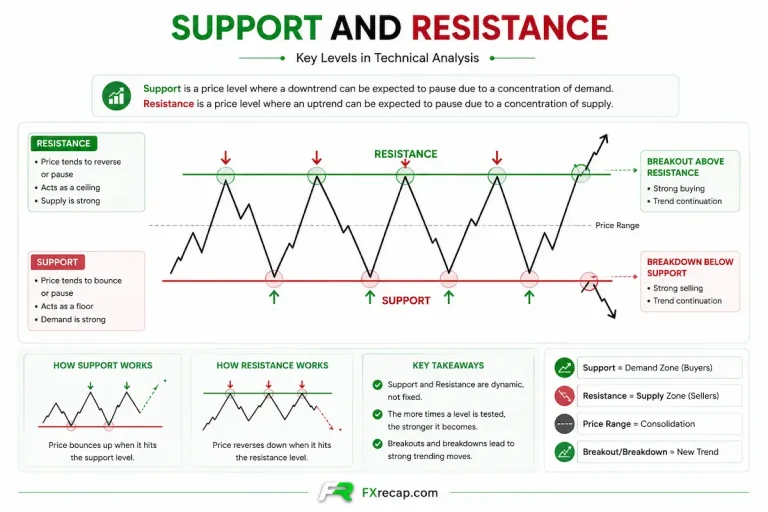
In a range-bound market, that can work. Price bounces between support and resistance, and so does the oscillator. But in a trend, it is a trap. A strong uptrend keeps the Stochastic RSI pinned above 80 for a long time, because momentum stays strong. Short every touch of 80 and you are shorting a rising market, again and again, bleeding on each one.
A trader who repeatedly buys oversold readings during a falling market can end up taking multiple countertrend positions as the decline continues.It was an expensive lesson. The oscillator was reflecting continued downside momentum, but the readings were being interpreted as automatic reversal signals.
The key point is that Stochastic RSI is primarily a momentum indicator and should not be treated as a standalone reversal signal. Respect the trend first, then use the oscillator to time your entry within it.
The Trend-Continuation Setup
This trend-continuation setup uses the moving average to define direction and Stochastic RSI to help time entries. It has three steps, and the order matters.
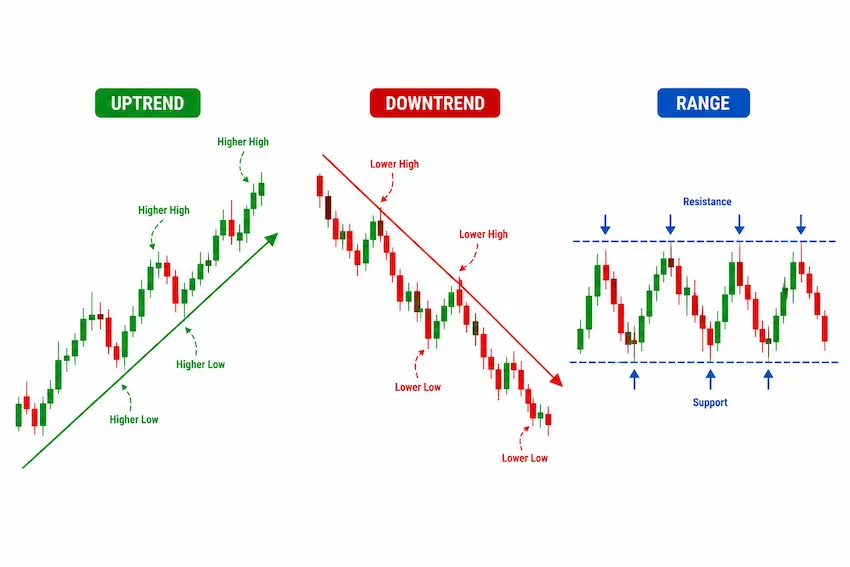
Step 1. Set the trend with a filter. Add a 50 EMA, or the 200 for a bigger view. Price above it, you take buys only. Price below it, sells only. A trend filter can help reduce countertrend trades, but it does not remove the risk of losing trades.
Step 2. Wait for a pullback into the oscillator’s extreme. In an uptrend, do nothing while the Stochastic RSI is high. Wait for the price to pull back and drag the oscillator down toward 20. That dip is the market making a temporary pullback, not reversing.
Step 3. Enter on the with-trend cross. When the fast %K line crosses back above the slower %D line out of that oversold zone, and price is still above your EMA, that is your entry. For this setup, traders may use the following candle as the entry trigger and place a protective stop beyond the pullback low, depending on their risk-management plan. In a downtrend, you mirror it: wait for the oscillator to push up to 80, then enter short when %K crosses below %D.
For this setup, a clear %K and %D crossover within the selected extreme zone is required before considering an entry. For this particular setup, readings between 20 and 80 are treated as lower-priority signals rather than primary entry zones. Do not invent trades there.
A Worked Example
Say EUR/USD is trading above its 50 EMA on the 1-hour chart, a clean uptrend. Your filter says buys only.
For a while the Stochastic RSI sits up near 90. You do nothing. Selling here would be fighting the trend, and the earlier warning about 80 is exactly why you wait.
Then the price pulls back for a few hours. The oscillator slides down to 18, into oversold. Price is still above the 50 EMA, so the trend is intact. This is the type of pullback the setup is designed to identify.
The %K line turns and crosses back above %D, climbing out of the oversold zone. That is your trigger. You enter long on the next candle, stop just below the pullback low, entering after a pullback rather than chasing price near a recent high.
Now the trap to skip. If price were below the 50 EMA and falling, that same oversold cross would be a countertrend trade against a downtrend. You leave it alone.
Divergence, the Divergence as Additional Confirmation
Beyond the pullback setup, the Stochastic RSI gives another useful signal: divergence.
If the price makes a lower low but the oscillator makes a higher low, momentum is quietly strengthening under a falling price, a bullish hint. If price makes a higher high but the oscillator makes a lower high, momentum is fading under a rising price, a bearish hint. Bearish divergence can signal weakening upside momentum, but it should be treated as a warning rather than confirmation of a reversal.
Same rules as always apply. Divergence is a heads-up, not a trigger, and it is easy to spot too early on such a jumpy indicator. Wait for a %K and %D cross to confirm it before you act.
The Best Settings
There is no single universal Stochastic RSI setting. A 14-period RSI is commonly used as a starting point, while the lookback and smoothing parameters can vary by platform and strategy. It balances speed against noise and works across most pairs and timeframes. Start here.
Shorter Stochastic RSI settings can make the indicator more responsive, but the increase in signal frequency can also lead to more false signals. Higher timeframes can reduce short-term market noise, but the most suitable Stochastic RSI settings depend on the instrument, timeframe and trading method. If you are new, leave it on 14-3-3 and focus on the trend filter, which matters far more than the exact numbers.
A Simple Way to Start
Add a 50 EMA to your chart and the Stochastic RSI on the 14-3-3 default below it. Before using the setup with real money, observe or backtest its behaviour across different market conditions. Notice how the oscillator stays pinned high while price climbs above the EMA, and how it only dips to oversold on the pullbacks. That pattern captures the basic idea of using Stochastic RSI to time pullbacks within an established trend.
Then trade one thing: an oversold %K over %D cross while price is above the 50 EMA, or the mirror to the short side. Skip everything else. A trend-following approach can use the prevailing market direction as the primary filter and Stochastic RSI as an entry-timing tool. The approach relies on waiting for trend-aligned setups rather than reacting to every oscillator reading.

FX Recap helps you find a trusted forex broker that keeps your trades secure and guides you through everything you need to know about FX instruments.

Ranjan Niskrity is a seasoned Crypto and Forex expert at FX Recap with over a decade of market experience. He specialises in verifying broker data, regulatory frameworks, and cryptocurrency trading insights. His rigorous fact-checking ensures every article meets the highest standards of accuracy.
Related Articles
 Education
7 min read
Education
7 min read

 Education
11 min read
Education
11 min read
 Education
7 min read
Education
7 min read
 Education
16 min read
Education
16 min read
