

 EUR/USD
  GBP/USD
  USD/ZAR
  EUR/INR
  EUR/GBP
  XAU/USD (Gold)
  XAG/USD (Silver)
  XM Global
  AvaTrade
  RoboForex
  IC Markets
  LiteFinance
  IUX Markets
  FP Markets
  South Africa
  Thailand
  Singapore
  Japan
Japan  Pakistan
  Malaysia
  Philippines
  Brazil
  Bangladesh
  Vietnam
  India
India 
MACD Guide: Trend and Momentum Analysis Made Simple
MACD is a trend-following momentum indicator that helps traders assess momentum and changes in market direction. It’s built from two moving lines and a bar chart that shows momentum building or fading. When the MACD and signal lines cross, it can indicate a change in momentum, while changes in the histogram can show whether momentum is strengthening or weakening. It’s one of the most popular tools out there, though like any indicator it can give false signals, so it’s best paired with confirmation before you trade.




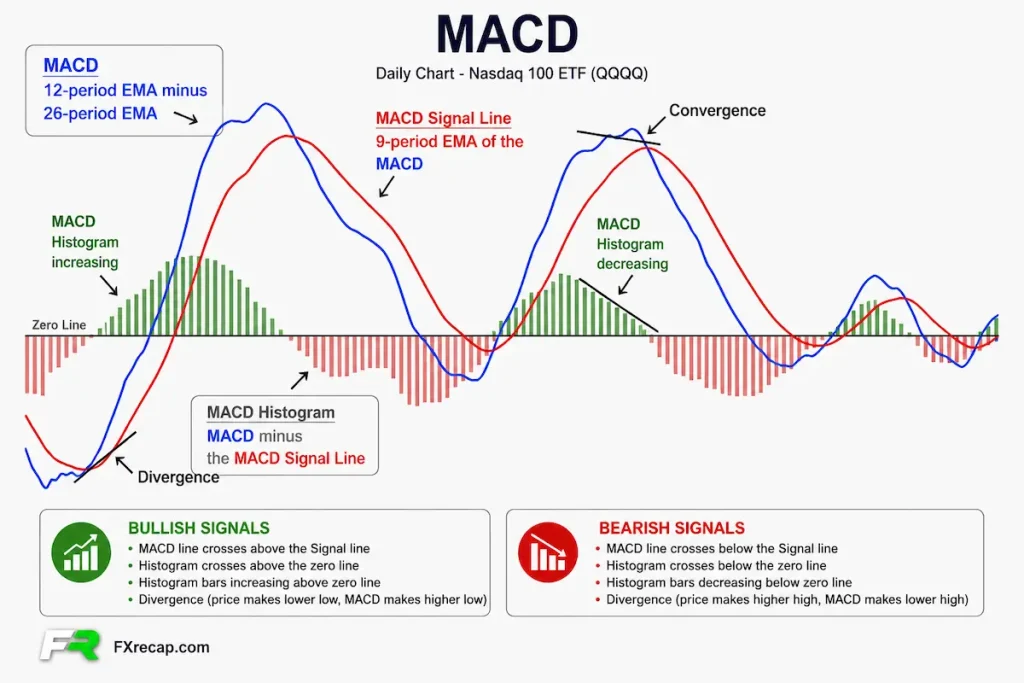
The MACD (Moving Average Convergence Divergence) is an indicator that combines trend and momentum analysis that shows both the direction of a trend and how much momentum is behind it, using two moving averages and a set of bars below your price chart.
When the MACD line crosses above the signal line, it can indicate improving bullish momentum; a cross below can indicate weakening momentum. When the MACD line is above the zero line, it indicates a bullish momentum bias; below zero indicates a bearish momentum bias. Those are the basic signals to understand first.
The important part is how you filter those signals. MACD fires a lot of crossover signals, and plenty of them are noise, especially in flat, choppy markets. The key is understanding which crossovers have stronger context and which are more likely to occur during market noise. A practical approach is to use the zero line and broader market trend as filters, rather than treating every crossover as a standalone signal.
Ignore the idea that MACD predicts the future. It is built from past prices, so it lags. It confirms a move rather than calling it in advance, and no setting changes that.
Where MACD Came From, and Why Traders Like It
Gerald Appel built the MACD in the late 1970s, and it has stayed on charts ever since. It shows up on nearly every platform alongside RSI as one of the two indicators almost everyone has seen.
Its appeal is that it does two jobs at once. Most indicators tell you either direction or strength. MACD gives you both from one window: which way the market leans, and how hard it is pushing. That two-in-one nature is why it survives while other indicators may gain or lose popularity over time.
The standard MACD calculation uses a 12-period EMA and a 26-period EMA. When the gap between the fast and slow EMAs widens, momentum is increasing in the prevailing direction; when the gap narrows, momentum is weakening. The remaining components help traders interpret that relationship.
The Three Parts of the Indicator
Open MACD and you see three things working together. The three components work best when read together.
The MACD line. This is the fast average minus the slow one. A positive MACD means the fast EMA is above the slow EMA, while a negative MACD means the fast EMA is below the slow EMA. It rises and falls as those two averages converge and diverge, which is where the name comes from.
The signal line. A smoothed, slower copy of the MACD line, set to 9 periods. TIt is commonly used as a confirmation line. When the MACD line crosses over it, that is your cue.
The histogram. The bars in the middle measure the space between the two lines. The histogram shows the difference between the MACD and signal lines; changes in its height can help traders assess whether momentum is strengthening or weakening. The histogram can change direction before a crossover occurs, giving traders an earlier indication that momentum may be weakening or strengthening.
The Signals, from Earliest to Most Reliable
MACD gives you a few different signals, and they trade off speed against reliability. Faster signals can react earlier but may produce more noise, while slower signals generally provide confirmation later.
| Signal | What MACD tells you |
| Histogram slope | The earliest hint. Bars shrinking means momentum is fading before the lines even cross. Underrated and worth watching. |
| Signal line crossover | MACD line crosses above the signal line for a buy cue, below for a sell cue. The most common signal, and the noisiest. |
| Zero line cross | MACD crosses above zero (bullish regime) or below (bearish regime). Slower but more reliable than a crossover. |
| Divergence | Price makes a new high or low but MACD does not. A warning that the trend is running out of fuel. |
A Worked Example
Say EUR/USD has been climbing and MACD is sitting above the zero line, so the trend leans bullish.
Price pulls back for a few days. On the indicator, the histogram bars shrink toward zero as momentum cools. The bullish bias remains intact, so the pullback can be monitored for confirmation rather than treated as an automatic sell signal.
The pullback ends. The MACD line turns and crosses back above the signal line while still above zero, and the histogram flips to growing bars. Three things now agree: trend up, crossover up, momentum building. That combination can provide a potential bullish setup, with risk placement determined by the trader’s strategy and the recent market structure.
Now the bearish divergence example. If price had pushed to a fresh high while the MACD line rolled over to a lower high, that bearish divergence would tell you the rally was showing signs of weakening momentum. A trader may consider reducing risk or waiting for confirmation rather than entering after an extended move.
The Best Settings
The commonly used MACD configuration is 12, 26, 9, although traders can adjust the parameters to suit different instruments and trading conditions. The 12, 26, 9 setting is a widely used starting point, but its behaviour can vary across instruments and timeframes.
| Style | Common setting | Trade-off |
| Scalping | 5, 13, 4 | Faster, catches quick shifts, but more false signals. |
| Day trading | 12, 26, 9 | The default. Balanced for most pairs and timeframes. |
| Swing trading | 12, 26, 9 | Default works well on 4-hour and daily charts. |
| Position trading | 19, 39, 9 | Slower, fewer signals, but each one carries more weight. |
A Simple Way to Start
Add MACD with the 12, 26, 9 default and, for a week, do not trade off it. Just watch. Note where the MACD line sits against the zero line, and see how the histogram grows and shrinks before the lines cross. Watching these changes can help traders understand how momentum develops before a crossover occurs.
Then use it as a filter, not a trigger on its own. Only take crossovers that agree with the zero line and the trend. Let the rest go. At FX Recap, the traders who get value from MACD treat it as a momentum gauge that confirms their read of the market, rather than a standalone buy or sell trigger. The goal is to avoid treating every MACD signal as a trade and instead evaluate the surrounding market context.

FX Recap helps you find a trusted forex broker that keeps your trades secure and guides you through everything you need to know about FX instruments.

Ranjan Niskrity is a seasoned Crypto and Forex expert at FX Recap with over a decade of market experience. He specialises in verifying broker data, regulatory frameworks, and cryptocurrency trading insights. His rigorous fact-checking ensures every article meets the highest standards of accuracy.
Related Articles
 Education
10 min read
Education
10 min read

 Education
22 min read
Education
22 min read
 Education
8 min read
Education
8 min read
 Education
7 min read
Education
7 min read
