

 EUR/USD
  GBP/USD
  USD/ZAR
  EUR/INR
  EUR/GBP
  XAU/USD (Gold)
  XAG/USD (Silver)
  XM Global
  AvaTrade
  RoboForex
  IC Markets
  LiteFinance
  IUX Markets
  FP Markets
  South Africa
  Thailand
  Singapore
  Japan
Japan  Pakistan
  Malaysia
  Philippines
  Brazil
  Bangladesh
  Vietnam
  India
India 
EMA Trading Strategy
An EMA is a moving average that gives greater weight to recent price data, making it more responsive to current market movements. Traders use it to see the trend at a glance and to spot entries when price pulls back to the line or when two EMAs cross. It is easy to read and can be applied across different timeframes, although its usefulness depends on the trading strategy and market conditions. Because the EMA is a lagging indicator, it is generally more useful when the market has a clear directional move and can produce more frequent false signals during sideways conditions.




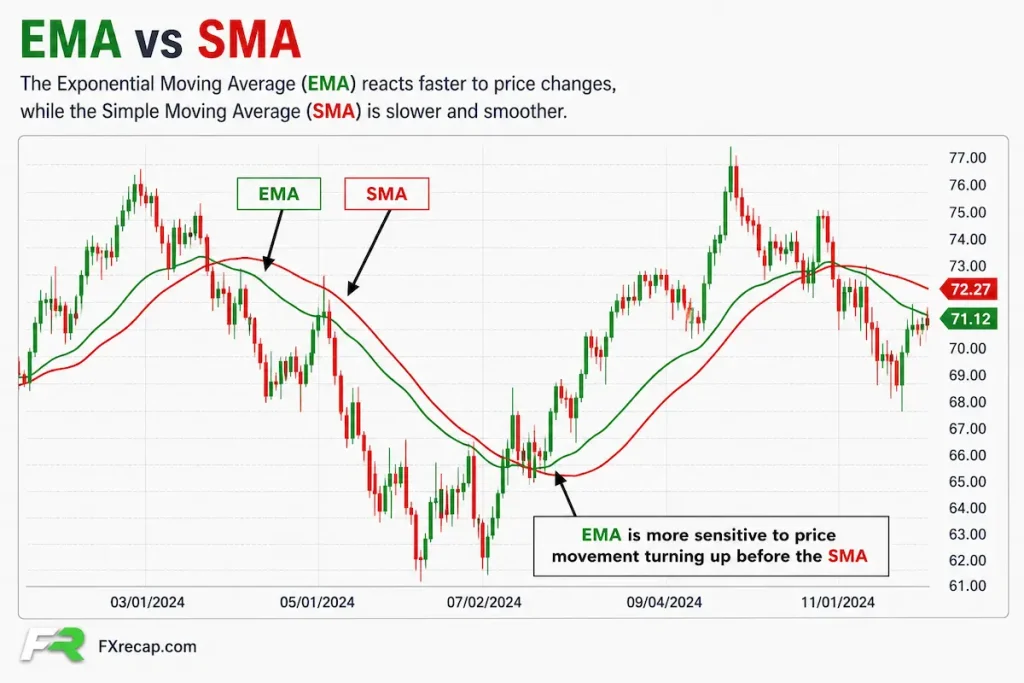
An EMA (Exponential Moving Average) is a line that follows price but weights the most recent bars more heavily, so it reacts fast, and a trend-following EMA strategy uses it to stay on the right side of a move and to time entries when price pulls back.
A basic EMA strategy uses a shorter-period EMA together with a longer-period EMA to assess market direction. When the faster EMA crosses above the slower EMA and price remains above both, traders may consider the setup bullish and look for additional confirmation. When it crosses below and price is under both, you look for sales. Common EMA combinations include 9 and 21 for shorter-term analysis, 20 and 50 for medium-term trend analysis, and 100 or 200 for broader trend direction. The most appropriate setting depends on the timeframe, instrument and trading approach.
The more important consideration is how the EMA is used in different market conditions. EMAs are primarily used to identify and follow trends, but they can also be applied in other market conditions. During sideways or range-bound markets, however, EMA crossovers can produce more false signals.
In a flat, choppy market the lines tangle together and every crossover is a fake. The crossover can help identify direction, but traders may improve signal quality by filtering sideways conditions and waiting for a pullback rather than entering after an extended move. A crossover can confirm a developing trend but may occur after part of the move has already taken place. A pullback approach instead waits for price to retrace before considering an entry.
Ignore the hunt for a perfect setting. There is no magic number. The 9, 20 and 200 periods are widely used reference points, but their popularity does not make them universally effective. Traders should select EMA periods according to their timeframe, strategy and market conditions. An EMA can act as a dynamic reference level during a trend, but price can move through it at any time and it should not be treated as guaranteed support or resistance.
EMA vs SMA
Both lines smooth out price so you can see the trend under the noise. The gap between them is speed.
A simple moving average treats every bar in its window equally. Yesterday’s price and last month’s price count the same. That makes it smooth but slow to notice a change. An EMA does not play fair on purpose. It gives the newest bars more weight, so it turns sooner when price shifts.
For short-term forex analysis, the EMA’s greater responsiveness can help traders identify changes in price momentum sooner than a comparable SMA. You spot a turn earlier. The cost is that the EMA also reacts to false moves faster, so it can shake you with a signal that fizzles. The greater responsiveness can also produce more frequent signals during volatile or sideways conditions. That trade-off runs through everything below.
Which EMA Periods Traders Use
The appropriate period depends on the trading timeframe, strategy and level of market volatility. Shorter-period EMAs respond more quickly to price movements and generally generate signals more frequently. Longer-period EMAs respond more slowly and are generally used to assess broader market direction. Here are the ones that matter.
| EMA | Who uses it | What it is good for |
| 9 or 21 | Scalpers, day traders | Fast triggers on 5-minute to 1-hour charts. Quick, but noisier. |
| 20 or 50 | Day and swing traders | The everyday trend line. Price often bounces off it in a healthy trend. |
| 100 or 200 | Swing and position traders | The big-picture filter. Above the 200 is bullish country, below it is bearish. |
Three Ways to Trade the EMA
EMA trading is really a handful of setups built on the same line. Pick one and learn it well before mixing them.
1. The crossover. Two EMAs, one fast and one slow, say the 9 and the 21. The fast crosses above the slow and you look to buy. It crosses below and you look to sell. Simple, and a good place to start, but crossovers lag. By the time the cross prints, a chunk of the move may be gone. Best treated as a trend signal, not a precise entry.
2. The pullback, or bounce. This is the one most experienced trend followers prefer. In an uptrend, price rarely climbs in a straight line. It dips back toward the EMA, then pushes on. You wait for that dip to the 20 or 50 EMA, look for a reversal candle off the line, and enter in the trend’s direction with a tighter stop. Better risk-to-reward than a crossover, because you buy the dip instead of the top of the push.
3. The 200-period EMA is commonly used as a longer-term trend reference. Some traders use price relative to the 200 EMA as a directional filter. Only take buys when price is above the 200 EMA, and only sells when it is below. The line splits the chart into bullish and bearish halves. It keeps you from a common mistake among newer traders of buying into a downtrend because a short-term signal looks tempting.
Some traders combine these signals to seek greater alignment between short-term entries and the broader trend. A pullback toward the 20 EMA that aligns with the broader trend can provide additional confirmation, although it does not guarantee a successful trade. Trend agreement is what separates a clean trade from a hopeful one.
A Worked Example
Say EUR/USD is trading above its 200 EMA on the 1-hour chart, so the bias is up. You are hunting buys only, not fighting the trend with shorts.
Price has been climbing above the 20 and 50 EMAs. Then it pulls back and dips to the 20 EMA. You do not buy blindly on the touch. You wait.
A bullish reversal candle forms right on the 20 EMA, price holds above it, and the line is still sloping up. That is your entry, with a stop just below the 50 EMA or the recent swing low. You are joining a trend on a dip, with the bigger 200 EMA backing you up.
Now the trap to avoid. If the 20 and 50 EMAs are flat and price repeatedly crosses both, the market may lack a clear directional trend, making crossover signals less reliable. A crossover there means nothing. You sit out and wait for a clearer directional move to develop.
The Best Settings
There is no single best. These periods are widely used by traders because they are commonly used reference periods, not because they are mathematically better. That said, some pairings are proven starting points.
- Scalping and fast day trading: 9 and 21 EMA on 5-minute to 15-minute charts.
- Swing trading: 20 and 50 EMA on 1-hour to daily charts, with the 200 for bias.
- For longer-term analysis, traders commonly monitor longer-period moving averages such as the 50, 100 and 200, particularly on higher timeframes.
If you are new, start with the 20 and 50 pair plus the 200 as a filter, and keep the setup unchanged initially. Endless tweaking to make a setting look perfect on old charts is a trap. It rarely holds up live, and it distracts from the parts that actually matter, trend and discipline.
A Simple Way to Start
Add three lines and no more: the 20, the 50, and the 200. For a week, observe the setup before applying it in live trading. Just watch how price behaves. Notice how it bounces off the 20 in a strong trend, and how the lines tangle and chop when there is no trend at all. That contrast is an important part of the approach.
Then trade one setup: a pullback to the 20 EMA, only in the direction the 200 EMA points. Skip everything else. At FX Recap, the traders who do well with EMAs keep their charts clean, trade with the trend, and wait for the pullback instead of entering after an extended move. The objective is to keep the chart simple and focus on consistent execution rather than continually adding indicators.

FX Recap helps you find a trusted forex broker that keeps your trades secure and guides you through everything you need to know about FX instruments.

Ranjan Niskrity is a seasoned Crypto and Forex expert at FX Recap with over a decade of market experience. He specialises in verifying broker data, regulatory frameworks, and cryptocurrency trading insights. His rigorous fact-checking ensures every article meets the highest standards of accuracy.
Related Articles
 Education
20 min read
Education
20 min read

 Education
9 min read
Education
9 min read
 Education
12 min read
Education
12 min read
 Education
12 min read
Education
12 min read
